Click here to watch time-lapse movie (6MB)
Up to 57mm fell in Narrabri Shire and storms delivered hail and wind gusts to 100km/h. This weather was poorly timed for many wheat growers who were in the middle of, or poised to harvest some of the best crops in years :-(
|
In Narrabri Shire the weather was roughly as follows: |
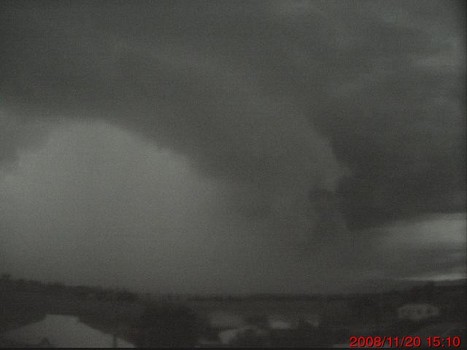
A few days earlier we had commissioned our Narrabri (North) weather station including a webcam overlooking the Nandewar Range. Click the image below to see a time-lapse movie of the storms on the Thursday.
The first storm, which almost causes the camera to black out, dropped some small hail and 14mm in about 5 minutes. The webcam station recorded a 92km/h gust at 13:22 while Narrabri Airport measured a gust of 100km/h at 13:35 and our Kaputar Rd station measured 82km/h also at 13:35. These latter two stations are on the extreme right of the webcam field of view. All three stations reported 14mm after this storm.
These three stations recorded the highest wind gusts measured in NSW on the 20th thanks to this storm. Other gusts in the Shire from this initial storm included 71km/h at Narrabri (Village) between 13:15 and 13:30, 77km/h at Cardale/Mollee at 13:15 and 69km/h at Merah North at 12:45.
The second noteworthy storm, around 15:10, dropped significant amounts of hail up to about 1cm diameter at the Kaputar Rd station and perhaps the Airport. This took Kaputar Rd to a total of 31mm and the Airport to 22mm. It shows up great on the webcam movie because the storm slipped just east of town, directly across the camera's field of view. On the RADAR this event seemed to involve the interaction between a storm moving roughly SE and another moving NE, which merged right above the weather stations.
Storm cells continued to develop and rumble throughout the afternoon, some of which are visible in the movie. The next storm to cross over town was at aroud 17:50. This dropped a few more mm of rain and passes overhead leaving a rainbow in it's wake near the end of the movie.
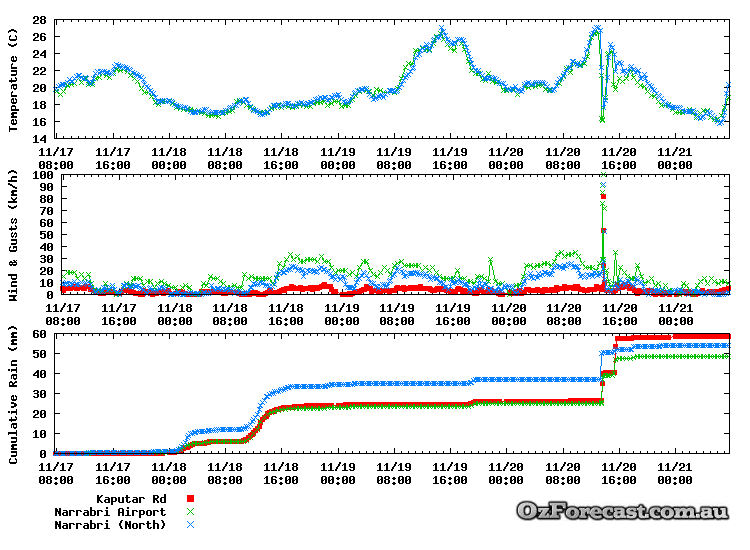
Below is a graph showing the data from the three weather stations discussed above, over a four day period:
Next is a chart of NSW showing the Convective Available Potential Energy (CAPE) predicted by the GFS weather model for 2pm (sorry no scale). CAPE is a measure of the energy available to drive the updrafts which power storms. The red dot indicates Narrabri's position:

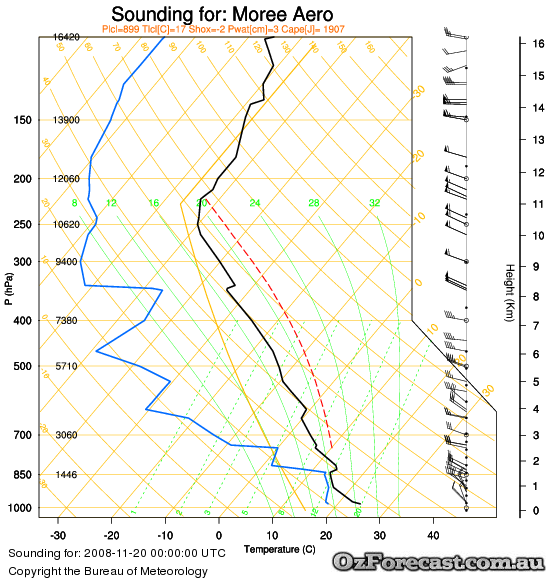
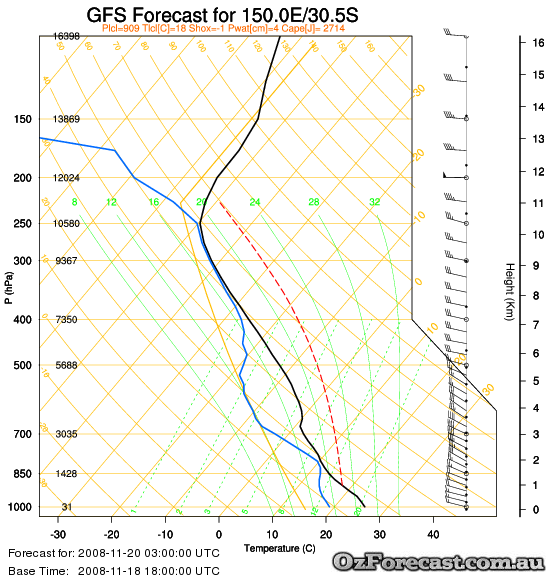
The charts below show skew-t diagrams, which are atmospheric soundings that display the wind, temperature and dew point at different altitudes. One diagram shows an actual balloon sounding from Moree taken around 10:00am, while the second diagram show the predicted sounding for near Narrabri at 2pm.
The Moree sounding shows the day started with relatively clear skies, while the forecast shows deep layers of cloud are present by afternoon. Both soundings show that the atmosphere is quite unstable and that strong winds are present in the upper atmosphere which helps severe weather to develop. Look here for a good tutorial on reading these diagrams.
 |
 |